This article explains how to make sense of the information contained within the Aircraft Traffic Assessment Scorecard, both for the Full and 31 Day assessments.

| Date of Survey | For the 31 Day Scorecard the date represents the end date and time for the survey. The start date and time is calculated 31 days earlier. Whereas for the Full Scorecard the date represents when the survey was requested and is for information only. |
| Location | Is the identifier for the location being surveyed. |
| Baseline geo-coordinates | The geo-coordinates, Lat & Long, are used to define the centre of the 1 mile Assessment airspace bubble. Typically this is the actual location of the point-of-interest. |
| Survey Type | Describes the type of assessment survey being reported. The full survey analyses 93 days of flight events based on 2019. The 31 Day survey uses the actual survey date, see above. |
| Assessment disruption band | The Assessment band category e.g. FREQUENT, OCCASIONAL, VERY HIGH etc. This is an important measure. |
| Assessment disruption value | The actual Assessment value. Useful for gaining an understanding where the location sits within the disruption band i.e. bottom, middle or top. This is an important measure. |
| Assessment description | A description that attempts to relate the Assessment to an equivalent road noise. |
| Band range. | Shows the lower and upper levels for the Assessment band. Designed to be used in conjunction with the Assessment disruption value. This is important data. |
| Flight holding stack identified? | If a fight holding stack is identified the returned value is ‘YES’. Meaning planes will be held in a holding loop at between 7,000-12,000 feet. Multiple planes can exist in the stack at the same time and the planes are in “fly” mode i.e. not gliding. |

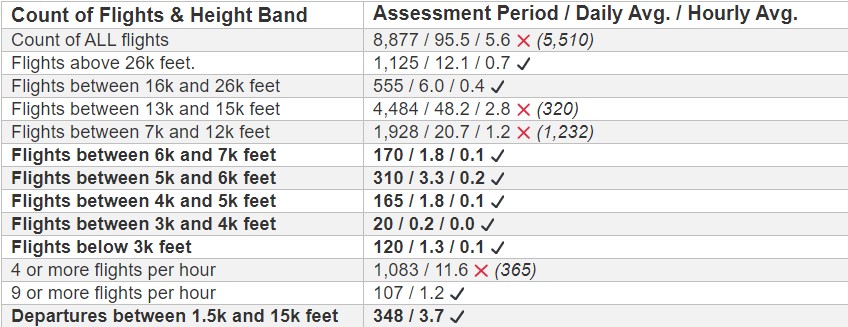
| Count of ALL flights | The total number of flights that occurred within the Assessment postcode for the entire period and then averaged by day and by hour. All flights are included, however those above 35,000 feet will have little impact. |
| Flights above 26,000 feet | The total number of flights that occurred above 26,000 feet within the Assessment airspace. Flights between 26,000 and 35,000 feet can be heard from the ground. Flights at this height are someway from the destination airport. |
| Flights between 16,000 and 26,000 feet | The total number of flights that occurred between 16,000 and 26,000 feet within the assessment period. Flights at this height implies the area is being overflown and the airspace is being used by 1 or more airports. |
| Flights between 13,000 and 16,000 feet | As above but between 13,000 and 16,000 feet. However, the planes will be clearly heard from the ground and will be clearly visible. |
| Flights between 7,000 and 12,000 feet | As above but between 7,000 and 12,000 feet. This is the height that most planes are held within holding stacks prior to landing. |
| Flights between 6,000 and 7,000 feet | The total number of flights that occurred between 6,000 and 7,000 feet. Planes leave their holding position at this height ready for final descent. |
| Flights between 5,000 and 6,000 feet Flights between 4,000 and 5,000 feet Flights between 3,000 and 4,000 feet | The total number of flights that occurred between 6,000 and 3,000 feet. At this height it implies the planes have recently departed or are about to land. Both scenarios will be relatively noisy. |
| Flights below 3,000 feet | See above but very visual too. |
| 4 or more flights per hour | The count of occurrences where 4 or more flights occurred within a single 60 minute period. For a flight to qualify it has to be below 26,000 feet. 4 flights within 60 minutes averages a flight every 15 minutes which gives the impression of a continuous background noise/rumble. |
| 9 or more flights per hour | The count of occurrences where 9 or more flights occurred within a single 60 minute period. For a flight to qualify it has to be below 26,000 feet. 9 flights within 60 minutes averages a flight every 7 minutes which gives the impression of a continuous background noise/rumble. |
| Departures between 1,500 and 15,000 feet | The total number of departures between 1,500 and 15,000 feet within the assessment period. Departures tend to be noisier than Arrivals. |

| Hours between 0:00 AM and 7:59 AM | The 2 values shown represent; 1) count of aircraft movements that occurred within a one hour period for the duration of the Assessment [93 days for the Full Assessment and 31 for the Latest Assessment], and 2) the average occurrences per day per hourly period. Planes below 26,000 feet occurring these times are very likely to disturb sleep patterns. |
| Hours between 8:00 AM and 9:59 PM | As above but also includes a 3rd value that represents the average count per hour within the 14 hour period (8:00am – 10:00pm) |
| Hours between 10:00 PM and 11:59 PM | As above. Planes below 26,000 feet occurring these times are very likely to disturb sleep patterns. |

| Time in seconds an aircraft existed in the Airspace Bubble | The average time in seconds it takes for a flight to travel through your airspace bubble which as a radius of 1 mile. The longer the period the greater will be the level of disruption. |
| Altitude for all flights | The average altitude for all flights passing through the area. |
| Altitude of departures between 1,500 and 15,000 feet | The average altitude for Departing flights that are between 1,500 and 15,000 feet. |
| Altitude of flights below 20,000 feet | The average altitude for all flights passing through the area that are below 20,000 feet. |
| Number of disruptions per day | The average daily number of disruptions to expect. Note: please see our article about how the disruption is calculated. This is an important measure. |
| Percentage of disruptions that occur Out-Of-Hours and at Weekends | The percentage of disruptions that occur at weekends and/or after hours. |
| Distance from baseline in miles | The average distance the disruptive flight was from the baseline co-ordinates, in fractions of a mile |

| Scale of regular disruption | Prior to making your final decision we recommend you validate our Assessment by an actual site visit. The scorecard includes a list of 10 dates and times when the disruptions are most likely to occur. |
| Period and Frequency. | E.g. Sunday @ 6:00 – 11 time(s) in 13 weeks. Approx:14 flight events. This example states that on Sunday mornings between 6:00am – 6:59am there is regularly* 14 flights over the postcode area. * 11 occurrences within the 13 week or 4 week Assessment period. |
